Reward Your Customers with Free Products, Not Just Coupons
Not every reward needs to be a discount. Now you can offer any product from your store as a loyalty or referral reward - customers claim it, add to cart, and it's free.
Continue Reading →
Not every reward needs to be a discount. Now you can offer any product from your store as a loyalty or referral reward - customers claim it, add to cart, and it's free.
Continue Reading →
Running an affiliate program, but not sure which KPI’s actually matter?
Many businesses launch affiliate programs hoping to boost their revenue, yet they end up not knowing what to track. Monitoring the right metrics can mean the difference between a successful affiliate program and one that’s just burning through your marketing budget.
In this guide, I’ll show you all the essential metrics you should track for your affiliate program.
Let’s get started!
Tracking the proper metrics reveals exactly how your affiliate program performs and where it needs improvement.
You can spot your top-performing affiliates, understand which products drive the most sales, and identify promotional strategies that actually work by tracking the right metrics.
Many affiliate programs fail because they focus on vanity metrics or no metrics at all. But successful businesses zero in on metrics that directly affect their affiliate program.
One must know that data tells a story about your program’s health. For instance, low conversion rates might signal that affiliates require better creative assets or product training or high click rates, but few sales could mean your landing pages require work.
By watching these patterns, you’ll catch problems early and make fixes before they hurt your growth, benefiting both your business and your affiliates.
Tracking the right metrics makes all the difference in running a successful affiliate program.
Here are the key metrics that will help you measure your program’s performance and make smarter decisions about its growth:
Your total affiliate revenue shows you exactly how much money your affiliate program brings to your business. This KPI helps you understand if your program is worth the investment and growing over time.
To calculate this, add up all sales made through affiliate links during your chosen period.
Formula:
Total Revenue from Affiliates = ∑(Sales from Affiliates)
For example, if Affiliate A generates $3,000 in sales and Affiliate B brings in $7,000, your total affiliate revenue is $10,000.
Businesses use this metric to make practical decisions.
Say, your total revenue is consistently growing, you might consider increasing commission rates to attract more affiliates. If certain months show lower numbers, you can plan special promotions or bonus structures to boost sales during slower periods.
Your affiliate conversion rate reveals how many visitors actually buy after clicking on an affiliate’s link.
Formula:
Conversion Rate (%) = (Number of Conversions ÷ Total Visitors) × 100
To find out your affiliate program’s conversion rate, divide your total affiliate sales by total affiliate clicks, then multiply by 100. If you get 1,000 clicks and 50 sales, your conversion rate is 5%.
A 1-3% conversion rate is common for most industries, 4-5% is strong, and anything above 6% is exceptional. These numbers change based on your product price and industry. A $2,000 software package naturally converts lower than a $20 e-book.
Low conversion rates often reveal specific problems you can fix. If an affiliate sends lots of traffic but few buyers, their audience might not match your product. If many affiliates show low conversions, your landing page might need work.
Average Order Value tells you how much money customers typically spend when buying through an affiliate link.
Formula:
AOV = Total Revenue ÷ Number of Orders
Calculate it by dividing your total affiliate revenue by the number of orders. For instance, if your affiliates brought in $10,000 from 200 orders, your AOV is $50.
This metric matters because it directly impacts your program’s profitability.
An affiliate sending 100 customers who spend $100 each ($10,000 total) is more valuable than one sending 200 customers who spend $40 each ($8,000 total).
Some businesses also use AOV data to optimize their affiliate commissions. Like, you can consider offering higher commission rates for orders above certain thresholds. This encourages affiliates to promote your higher-priced items or create content that drives larger purchases.
EPC shows you how much money you make each time someone clicks an affiliate link. This metric helps both you and your affiliates understand the true value of their traffic.
Formula:
EPC= Total Earnings ÷ Total Clicks
For instance, if your total affiliate earnings are $2,000 from 4,000 clicks, your EPC is $0.50.
This metric matters to you as it shows how efficiently your program converts traffic into money. And your affiliates, as it helps them compare your program to others and decide where to focus their efforts.
An EPC of $1 or higher is excellent, $0.50-$1 is solid, and below $0.30 might need attention.
The active affiliate ratio reveals what percentage of your affiliates are actually promoting your products. This KPI helps you understand if your program engages affiliates effectively or requires improvement.
To calculate this metric, divide your number of active affiliates by total affiliates and multiply by 100.
Formula:
Active Affiliate Ratio = (Number of Active Affiliates ÷ Total Number of Affiliates) × 100
For example, if 50 affiliates out of your 200 total affiliates are actively promoting, your active affiliate ratio is 25%.
This metric helps you spot engagement problems early. A low ratio might mean your onboarding needs work or your commission structure isn’t motivating enough.
Track this monthly to see if new affiliates stay active after joining your program.
Your affiliate CLV reveals how much money affiliate-referred customers spend throughout their entire relationship with your business. This helps you understand the true value of customers your affiliates bring in.
The formula considers three key factors: how much customers spend per purchase, how often they buy, and how long they stay customers.
Formula:
CLV = Average Purchase Value × Purchase Frequency × Average Customer Lifespan
For example, if affiliate customers spend $50 per order, buy 4 times yearly, and stay customers for 5 years, their CLV is $1,000 ($50 × 4 × 5).
You should track this metric to adjust your commission rates fairly. High-CLV affiliates might deserve higher commissions since they bring in more valuable long-term customers.
Additionally, you can track CLV by affiliate type too. Content creators might bring in customers with a 30% higher CLV than coupon sites because they build more trust through detailed reviews and tutorials.
Your affiliate program’s ROI tells you how much money you make compared to what you spend. This metric proves if your program actually profitable and worth continuing.
To find your ROI, subtract all program costs from affiliate revenue, divide by costs, then multiply by 100.
Formula:
ROI = ((Revenue from Affiliates – Total Program Costs) ÷ Total Program Costs) × 100
For example, if affiliates generate $10,000 in revenue and your total costs (commissions, software, management) are $2,000, your ROI is 400%. This means you’re making $4 for every $1 spent on your program.
Break down your ROI calculation to spot opportunities for improvement. Include costs like:
Track this metric quarterly to ensure your program stays profitable. A healthy affiliate program should show ROI between 300% and 800%, depending on your industry and margins.
If your ROI falls below 200%, examine your commission structure and program costs.
Tracking every important metric manually using formulas for your affiliate program can quickly become overwhelming. There are tons of them like calculating conversion rates to monitoring affiliate performance.
That’s why investing in a robust affiliate program management tool like AffiliateWP becomes essential.
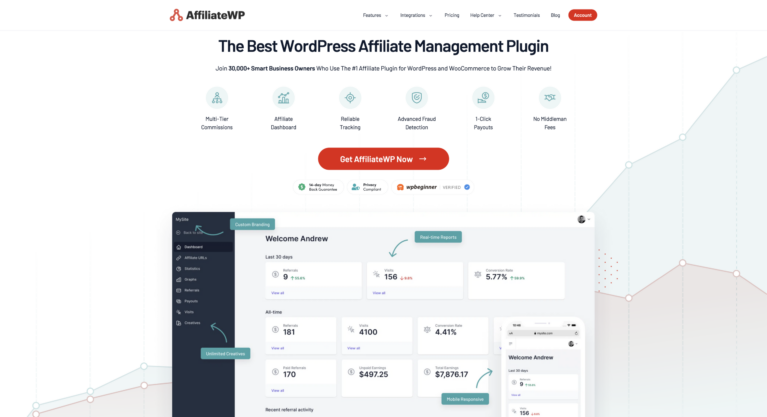
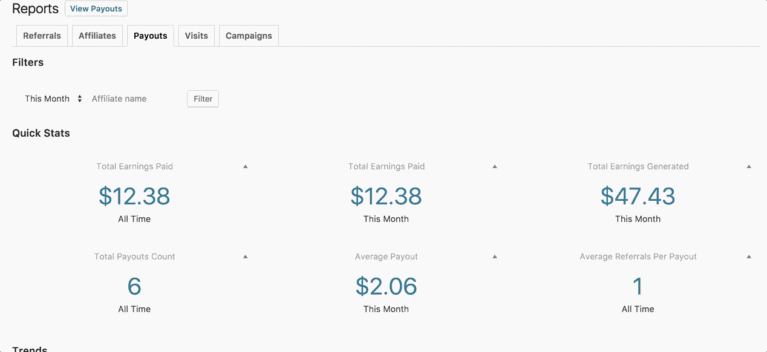
With AffiliateWP’s built-in reports, you get instant access to all your essential program data in one place.
AffiliateWP’s reports show you exactly how your affiliate marketing is performing. You can see detailed breakdowns of referrals over time, track your affiliates’ success, and monitor critical numbers like payouts and visits.
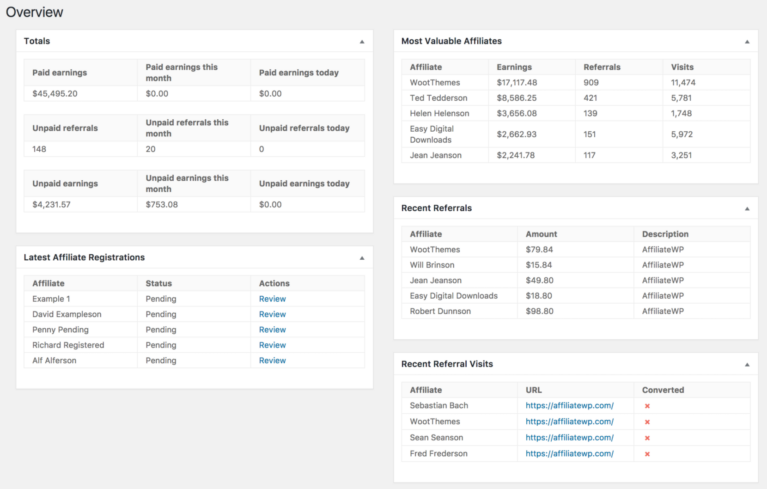
The reporting dashboard lets you filter data by specific affiliates or times, making it easy to spot trends and patterns.

The Quick Stats section gives you a snapshot of what matters most, from paid earnings and unpaid referrals to conversion rates and top-performing affiliates.

Want to see how your program is doing this month compared to last? The Trends graphs show you this at a glance, with clear visuals for different types of data like paid versus unpaid referrals.
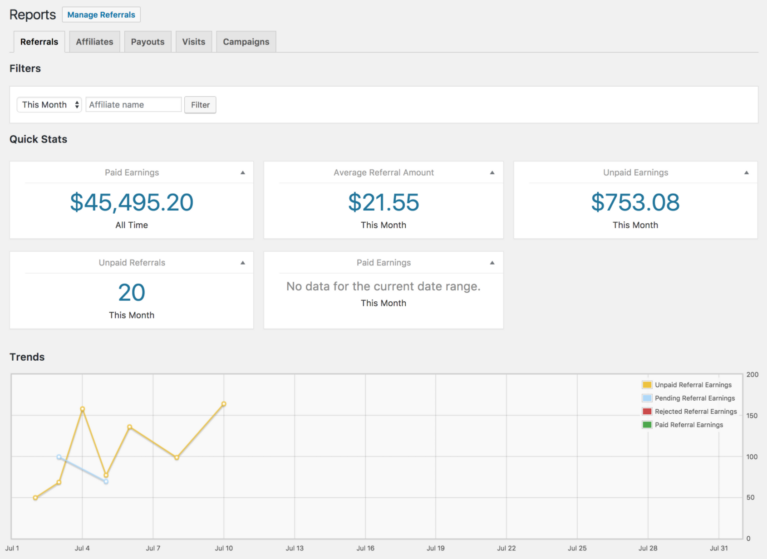
Best of all, you can customize these reports to show exactly what you need.
Liked this post? Refer to our detailed guides and learn more about growing your affiliate program:
Now there’s only one more thing left. Start managing your affiliate programs with AffiliateWP and get ready to skyrocket your growth.
Disclosure: Our content is reader-supported. This means if you click on some of our links, then we may earn a commission. We only recommend products that we believe will add value to our readers.
Launch your affiliate program today and unlock a new revenue channel to grow your business faster.
We use cookies to improve your experience on our site. By using our site, you consent to cookies.
Manage your cookie preferences below:
Essential cookies enable basic functions and are necessary for the proper function of the website.
Statistics cookies collect information anonymously. This information helps us understand how visitors use our website.
Marketing cookies are used to follow visitors to websites. The intention is to show ads that are relevant and engaging to the individual user.