




Want a quick read on how your rewards program is doing? The RewardsWP dashboard gives you a snapshot of how your rewards program is performing.
It surfaces key metrics like revenue, member growth, and redemption activity. It also shows charts, insights, and a live activity feed. These help you spot trends and make informed decisions without digging through individual records.
This guide walks through each part of the RewardsWP dashboard.
- Find the dashboard and set the date range
- KPI sections
- Rewards-applied revenue
- New members
- Active members
- Points earned/redeemed
- First-time redeemers
- Completed referrals
- Orders using rewards
- Health badges
- Trends
- Program Insights
- Things to do next
- Recent Activity
- Frequently asked questions
Before you get started, make sure RewardsWP is installed and activated on your site.
See Installing RewardsWP.
Find the dashboard and set the date range
The dashboard is the first screen you see when you open RewardsWP.
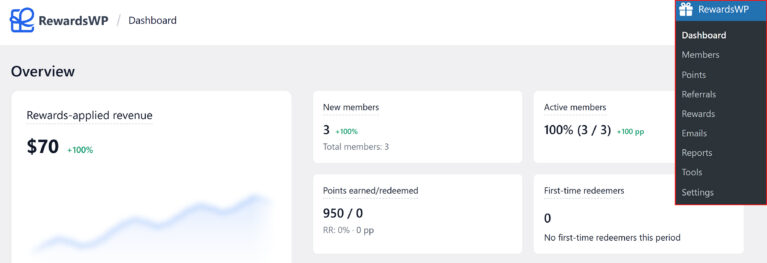
To get there, click RewardsWP in your WordPress admin sidebar. Site administrators can access the RewardsWP dashboard and its settings.
In the top-right corner of the dashboard, you’ll see a date range picker and your store’s timezone indicator (for example, “UTC”). The picker defaults to Last 30 days.
The date range you select here controls the time window for all KPI sections on the page. Available options are:
- Last 7 days. Choose this if you want to see the past week.
- Last 14 days. Choose this if you want to see the past two weeks.
- Last 30 days. Choose this if you want a monthly view. This is the default.
- Last 60 days. Choose this if you want to see about two months.
- Last 90 days. Choose this if you want to see about three months.

Next, the KPI sections show your key numbers for the date range you picked.
KPI sections
The top of the dashboard displays a grid of key performance indicator (KPI) sections. Each section shows a primary number, a trend indicator comparing the current period to the previous one, and supporting details.
Rewards-applied revenue
This is the largest section on the dashboard. It shows the net sales from orders where a customer used a RewardsWP incentive, such as a points-based discount or a referral reward. The number excludes tax and shipping, and subtracts any refunds.
This section includes a sparkline chart that shows revenue over the last 12 weeks, giving you a visual trend line at a glance. Next to the sparkline, a percentage delta compares the current period to the previous one. For example, the delta can be a green “+15%” or a red “-8%”.
When there isn’t enough data yet (fewer than five orders using rewards), the section displays a “Not enough data yet” message. It adds a note: “When more orders use rewards, this chart will show the revenue they drive.”

Next, the New members section shows how many members joined your rewards program.
New members
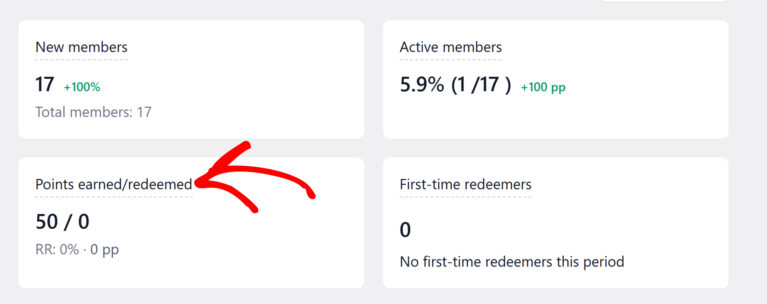
This section tracks how many new members joined your rewards program during the current period. Below the count, a subline shows the total number of members across your entire program (for example, “Total members: 17”). It gives you context for the growth number. A percentage delta next to the count compares enrollment to the previous period.
Next, the Active members section shows how many members earned or redeemed points.
Active members
This section shows the percentage and count of members who earned or redeemed at least once during the current period. For example, “5.9% (1 / 17)”. It includes a delta measured in percentage points (pp) comparing engagement to the previous period, and its own health badge.
Next, the Points earned/redeemed section shows how many points members earned and redeemed.
Points earned/redeemed
This section tracks the total points earned and redeemed during the current period, displayed as a ratio (for example, “50 / 0”). Below the values, the redemption rate (RR) shows what percentage of earned points were redeemed, along with a percentage-point delta. A healthy redemption rate means members find your rewards valuable and are coming back to use them.

When the points program is disabled, this section shows a “Program off” badge with a link to enable points.
Next, the First-time redeemers section shows how many members redeemed a reward for the first time.
First-time redeemers
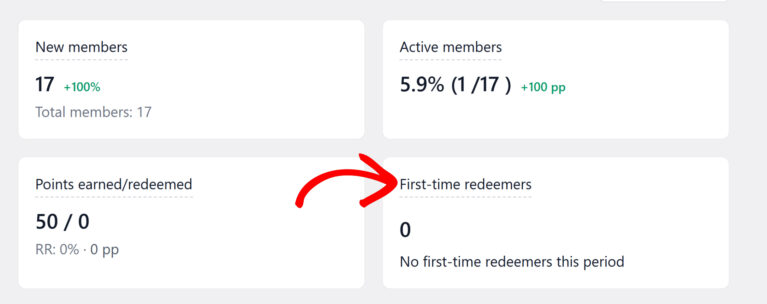
This section shows how many members redeemed a reward for the very first time during the current period. It measures how many people are reaching the “first reward” milestone. When there’s no activity, it displays “No first-time redeemers this period.”
Next, the Completed referrals section shows how many referrals reached completed status.
Completed referrals
This section shows the number of referrals that moved to a completed status during the current period. When there’s no activity, it displays “No completed referrals yet” with a note: “When referred friends purchase, they’ll appear here.”
When the referral program is disabled, this section shows a “Program off” badge with a link to enable referrals.

Next, the Orders using rewards section shows the share of orders that used a RewardsWP incentive.
Orders using rewards
This section shows the percentage of orders that used a RewardsWP incentive at checkout. A higher share means rewards are influencing more of your sales. When there’s no activity, it displays “No orders used rewards this period.”
Next, the health badges show how each metric is performing.
Health badges
Several KPI sections include a health badge that provides a quick assessment of how that metric is performing. Each badge uses the same three-level system but applies different thresholds depending on the metric:
Badge What it means Healthy The metric is performing well. No action needed. Okay Performance is moderate. There may be room to optimize. Attention The metric needs review. Consider adjusting your program configuration. For the Rewards-applied revenue section, the badge measures the ratio between the revenue your program generates and the discounts it gives away. The Active members badge is based on the percentage of engaged members. The Points earned/redeemed badge tracks the redemption rate.
The badges update automatically as your data changes.
Trends
Below the KPI sections on the left side of the dashboard, the Trends section shows a larger chart with two tabs:
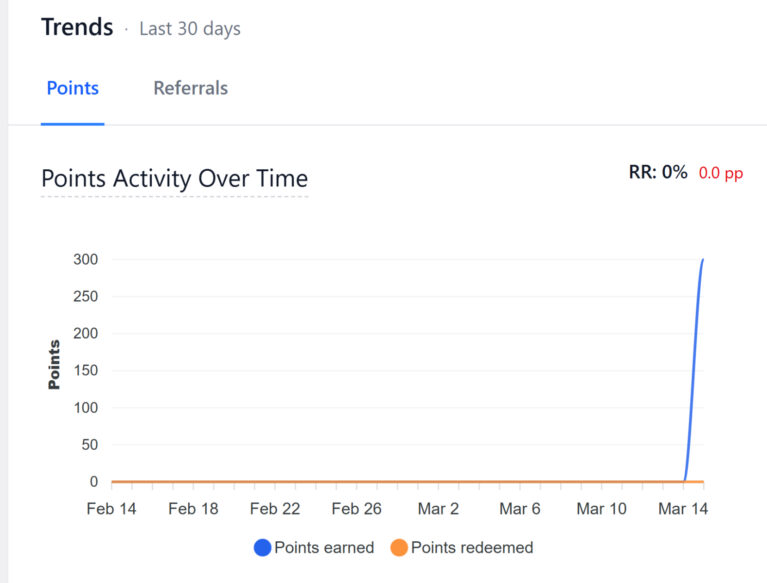
- Points: Displays a “Points Activity Over Time” chart that plots points earned and points redeemed as separate data series over the selected date range. This chart gives you a visual picture of how earning and redeeming activity flows over time. The chart header also shows the overall redemption rate (RR) and its period-over-period delta.

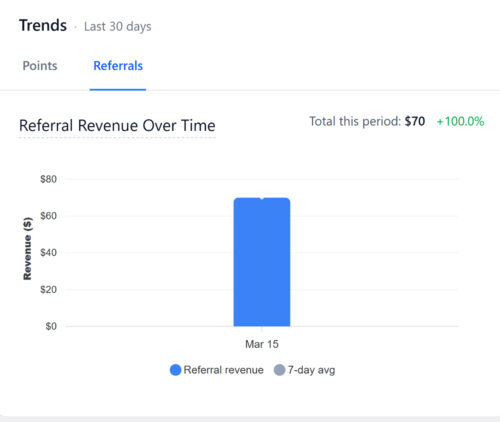
- Referrals: Displays referral activity trends over the same period.
To switch the chart to referral activity, select the Referrals tab.

The Trends section uses the same date range as the KPI sections (shown in the section header, for example “Last 30 days”).
Next, the Program Insights section shows your top referrers and most redeemed rewards.
Program Insights
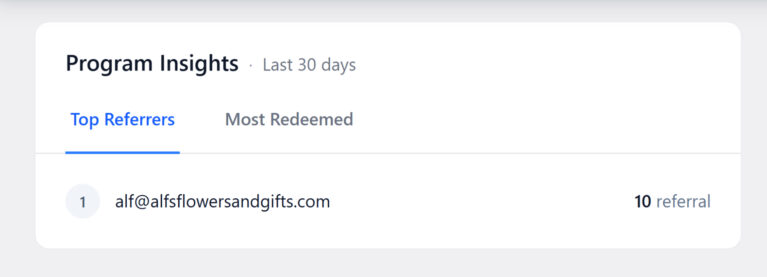
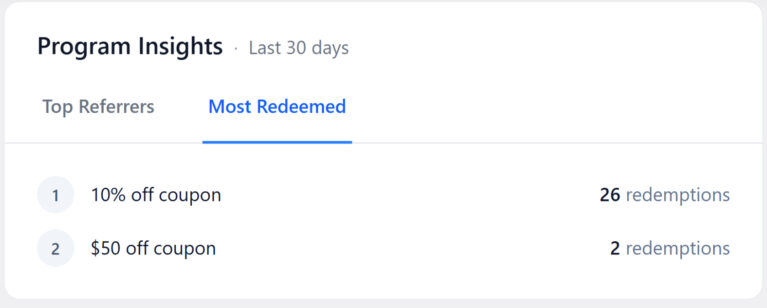
Below the Trends chart, the Program Insights section highlights your top performers with two tabs:
- Top Referrers: Shows the members who have driven the most successful referrals. When there’s no referral activity yet, it displays “No top referrers yet.” It adds a note: “Once members start referring others, your top performers will show here.”

- Most Redeemed: Shows which rewards are being redeemed most frequently, helping you understand which incentives resonate with your members.
To see the rewards members use most, select the Most Redeemed tab.

This section helps you identify your most valuable advocates and your most popular rewards at a glance.
Things to do next
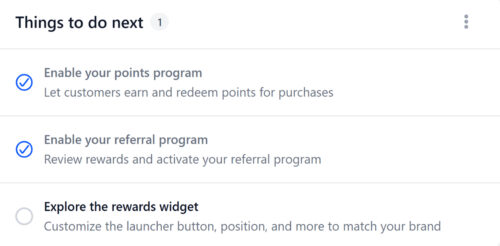
When you first install RewardsWP, the dashboard displays a Things to do next checklist on the right side. It helps you get your program up and running. The checklist includes tasks such as:
- Enable your points program: Let customers earn and redeem points for purchases.
- Enable your referral program: Review rewards and activate your referral program.
- Explore the rewards widget: Customize the launcher button, position, and more to match your brand.
Each task links directly to the relevant settings page. Completed tasks show a green checkmark.
The counter next to the heading (for example, “1”) shows how many tasks remain. Once you’ve completed all tasks or dismissed the checklist, it won’t appear again.

Next, the Recent Activity feed shows a stream of member actions on the right side of the dashboard.
Recent Activity
On the right side of the dashboard, the Recent Activity feed shows a chronological stream of member actions. Each entry includes a colored status dot, the member’s name (linked to their profile), a description of what happened, and a timestamp.
Typical entries include:
- A member joined the rewards program
- A member earned points for a specific order (with a link to the order)
- A member earned points for a product review (naming the reviewed product)
- A member redeemed points for a reward (showing the reward name and points spent)

Points for a review arrive when the review is approved, not when the customer submits it.
See Earning points from sign-ups, reviews and first orders.
The feed gives you a quick pulse on day-to-day program activity without navigating to individual member profiles or separate report pages.
With the VIP Program on, Recent Activity also lists VIP events. These events cover a member reaching a tier, moving to a lower tier, leaving VIP, or receiving bonus points as a tier gift. When a settings change places many members at once, they appear as a single grouped entry.
See Tracking VIP Tiers With Reports and Exports.
That’s it! You now know how to read the RewardsWP dashboard, from the KPI sections and health badges to the Trends charts and the Recent Activity feed. Next, see Understanding the points program or Understanding the rewards widget.
Frequently asked questions
Below, we’ve answered some of the most common questions about the RewardsWP dashboard.
What counts toward my rewards-applied revenue?
It counts net sales from orders where a customer used a RewardsWP incentive, such as a points-based discount or a referral reward. Tax and shipping are left out, and refunds are subtracted.
See the Rewards-applied revenue section above.
How often do my dashboard metrics update?
Metrics update in real time as orders are placed, points are earned, and referrals are tracked. When you load or refresh the dashboard, you’ll see the latest data.
Can I change the time period for the dashboard?
Yes. To change it, use the date range picker in the top-right corner of the dashboard. A new range updates all KPI sections and the Trends charts.
See the Find the dashboard and set the date range section above for each option.